
Mixed
VMware, Proxmox and Nutanix each come with their own console, and the physical estate has another. Nobody sees across them.
IT OPERATIONS
Unified360IT operations & observability platformNetwork TopologyAuto-discovered mapsLink UtilizationBandwidth and link qualityBusiness Service ManagementApplications, services and impactIPAMSubnets, IPs and conflictsAlerting & EscalationDetect, notify, recoverSERVICE & ASSETS
ITDeskIT service management platformIncidents & SLAsOne desk for every requestIntelliAssetIT asset & patch managementPatch ManagementDetect, deploy, roll backISMS Audit PackISO 27001 evidence, readyBY CHALLENGE
Blind Spots in InfrastructureNo extra tools: hardware to URLs on one screenSlow Ticket ResolutionRoute, watch and escalate to fix fasterUnknown Assets & Unpatched SystemsKnow what you own, patch what's exposedUncontrolled Privileged AccessVault, approve, record and auditManual, Repetitive OperationsAutomate approvals and remediationAudit & Compliance PressureEvidence on demandBY STACK
Networks & WirelessSwitches, firewalls and controllersServers & DatabasesWindows, Linux and leading databasesVirtual & Hybrid EstatesHypervisors and hybrid workloadsEndpoints & DevicesAgent-based inventory and updatesRemote & Privileged SessionsAgentless SSH, RDP and VNCTools & IntegrationsITSM, SIEM, webhooks and emailLEARN
Quick Start GuidesSoonGet productive with any Autointelli product in minutes.Product DocumentationAdmin manuals, how-tos and API references.Integration CatalogSoonWhat Autointelli connects to, and how.IT Terms ExplainedPlain-language definitions of everyday IT jargon.DISCOVER
Customer StoriesHow organisations get measurable results.WhitepapersResearch on IT operations, ITSM, ITAM and PAM.Ebooks & PlaybooksPractical, step-by-step operating guides.Product DatasheetsCapabilities and technical specifications.Why AutointelliHow we differ from other platforms.Compare AutointelliSide-by-side with tools you may be weighing.Solution · By Stack
Most estates are a mix: VMware here, Proxmox there, a Nutanix cluster, and physical servers underneath. Unified360 watches hosts, virtual machines, datastores and storage pools across all three platforms next to the rest of your infrastructure, so contention and capacity problems show up in one place.
The problem
A VM is only as healthy as the host and storage under it, and those are rarely on the same screen.
VMware, Proxmox and Nutanix each come with their own console, and the physical estate has another. Nobody sees across them.
A VM slows down because of the host or the datastore, not the VM. The cause sits a layer away from the symptom.
Guests get created faster than they get backed up, and storage fills quietly underneath.
Where it goes wrong
How it goes wrongVMware, Proxmox and Nutanix each need their own tool and their own skills.
Closed withUnified360 monitors VMware vCenter, Proxmox and Nutanix Prism Central, with an overview dashboard for vCenter and per-platform detail dashboards.
How it goes wrongA VM shows low CPU but waits for the host to schedule it.
Closed withVMware CPU ready time, memory ballooning and swap-in are alertable, on hosts and VMs.
How it goes wrongThin-provisioned storage grows until a VM stops.
Closed withDatastore, Proxmox storage, Nutanix pool and container use, each with its own alert and a capacity figure.
How it goes wrongA VM exists, but nobody set up its backup.
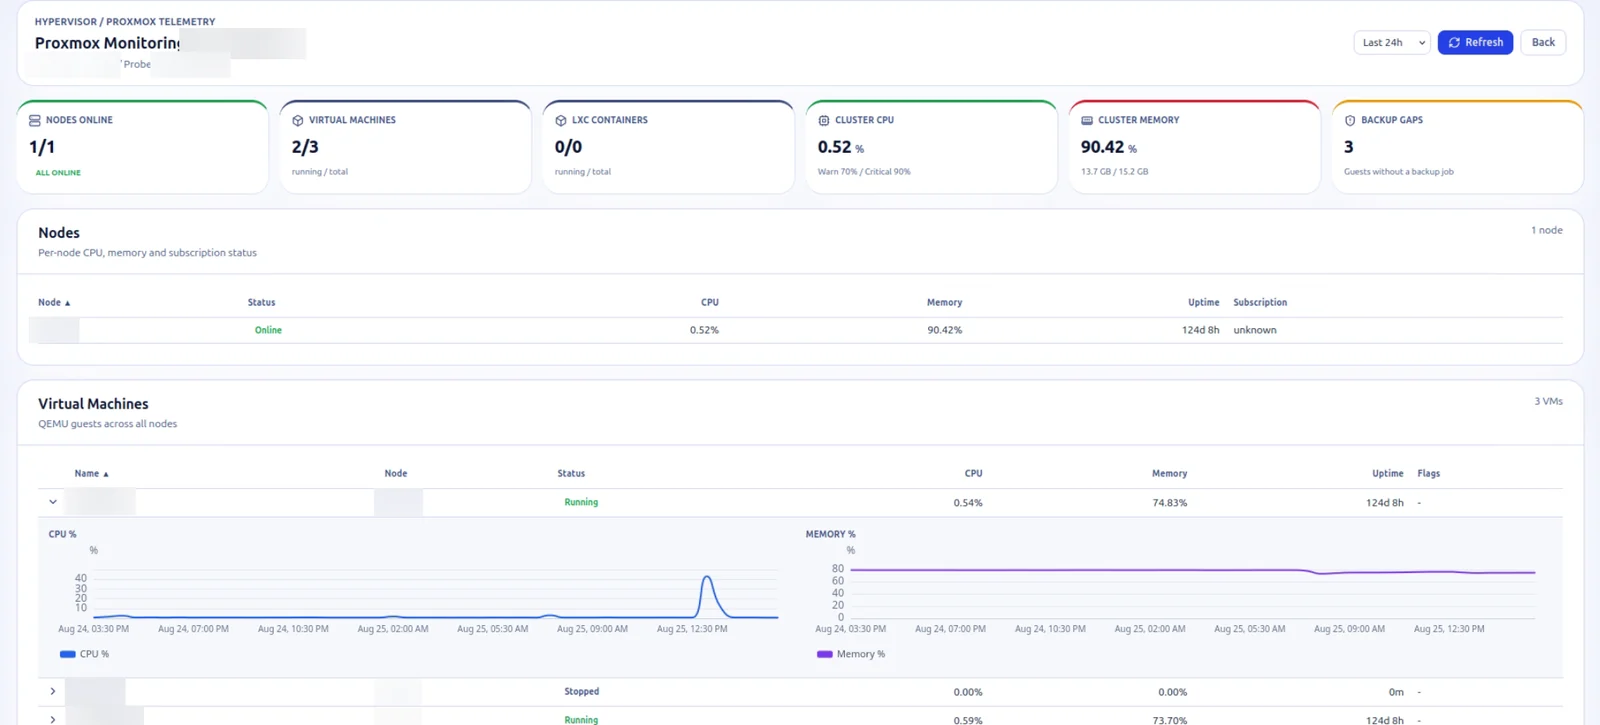
Closed withProxmox shows guests without a backup job, next to node, VM and container health.
How it goes wrongA failing fan or disk on a host is invisible from inside the hypervisor.
Closed withiDRAC and iLO monitoring for the physical hosts, in the same platform.
How it goes wrongA guest fills its disk and someone logs in to clean up.
Closed withAutomated Actions can run approved scripts inside Windows and Linux guests when an alert fires.
Platforms
Pick a platform to see what Unified360 tracks and the alerts you can build.
Hosts, virtual machines and datastores through vCenter, collected with Telegraf's vSphere input.
VMware vCenter
Nodes, QEMU virtual machines, LXC containers and storage.
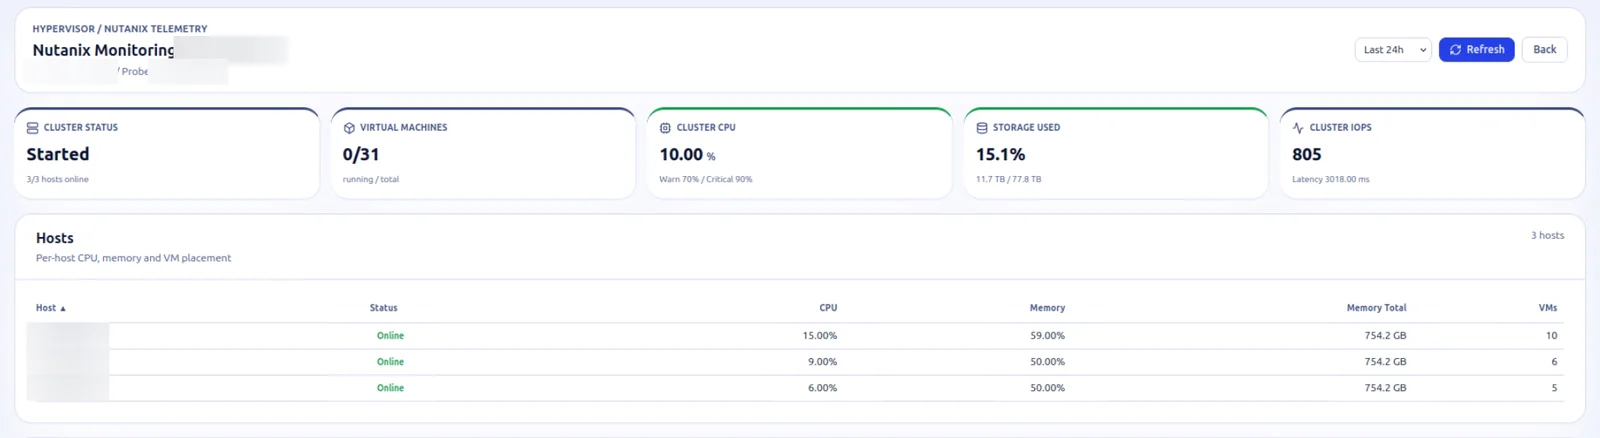
Clusters, hosts, VMs, storage pools and containers through Prism Central over SNMP.
Metric names are the ones you can build alert rules on. Hyper-V and public-cloud VMs are not covered by these monitors.
What changes
VMware, Proxmox and Nutanix report into the same platform as the servers and databases in their guests.
CPU ready time, ballooning and swap-in explain slowness that CPU use alone can't.
Datastore and pool use are alerted on, with capacity figures alongside.
Proxmox backup gaps become a number you can drive to zero.
Built with
Questions
VMware vCenter, Proxmox and Nutanix (through Prism Central). Hyper-V and public-cloud VMs are not covered by these monitors.
CPU use, CPU ready time and memory use on hosts and VMs, host memory swap-in, VM memory ballooning, and datastore used percentage and capacity.
Proxmox alerts cover CPU and memory on nodes, VMs and containers and storage use, and its dashboard shows guests without a backup job. Nutanix alerts cover CPU and memory on hosts and VMs and storage pool and container use.
Yes. A virtualization rule targets one host, VM, node, pool or datastore rather than the whole cluster, so thresholds can differ by object.
VMware through Telegraf's vSphere input, Proxmox through the Proxmox exporter and Nutanix through SNMP against Prism Central, into InfluxDB, from a monitoring agent at the site.
Yes. Install the server agent in a Windows or Linux guest and it is monitored like any other server, including services, files and databases.
Yes. Dell iDRAC and HPE iLO monitoring covers health, power and temperature, in the same platform.
See it on your own estate
Tell us which platforms you run and we'll show you Unified360 covering them. No commitment required.