
Layered
Hardware, operating system, services and databases each have their own tool and their own owner, and nobody traces across them.
IT OPERATIONS
Unified360IT operations & observability platformNetwork TopologyAuto-discovered mapsLink UtilizationBandwidth and link qualityBusiness Service ManagementApplications, services and impactIPAMSubnets, IPs and conflictsAlerting & EscalationDetect, notify, recoverSERVICE & ASSETS
ITDeskIT service management platformIncidents & SLAsOne desk for every requestIntelliAssetIT asset & patch managementPatch ManagementDetect, deploy, roll backISMS Audit PackISO 27001 evidence, readyBY CHALLENGE
Blind Spots in InfrastructureNo extra tools: hardware to URLs on one screenSlow Ticket ResolutionRoute, watch and escalate to fix fasterUnknown Assets & Unpatched SystemsKnow what you own, patch what's exposedUncontrolled Privileged AccessVault, approve, record and auditManual, Repetitive OperationsAutomate approvals and remediationAudit & Compliance PressureEvidence on demandBY STACK
Networks & WirelessSwitches, firewalls and controllersServers & DatabasesWindows, Linux and leading databasesVirtual & Hybrid EstatesHypervisors and hybrid workloadsEndpoints & DevicesAgent-based inventory and updatesRemote & Privileged SessionsAgentless SSH, RDP and VNCTools & IntegrationsITSM, SIEM, webhooks and emailLEARN
Quick Start GuidesSoonGet productive with any Autointelli product in minutes.Product DocumentationAdmin manuals, how-tos and API references.Integration CatalogSoonWhat Autointelli connects to, and how.IT Terms ExplainedPlain-language definitions of everyday IT jargon.DISCOVER
Customer StoriesHow organisations get measurable results.WhitepapersResearch on IT operations, ITSM, ITAM and PAM.Ebooks & PlaybooksPractical, step-by-step operating guides.Product DatasheetsCapabilities and technical specifications.Why AutointelliHow we differ from other platforms.Compare AutointelliSide-by-side with tools you may be weighing.Solution · By Stack
When an application slows down, the cause can be the hardware, the operating system, a stopped service, or a database under pressure. Unified360 watches every layer from the iDRAC to the wait class, for Windows and Linux servers and four database engines, so you can trace a symptom down the stack in one place.
The problem
Each team sees its own layer. The symptom lives in all of them.
Hardware, operating system, services and databases each have their own tool and their own owner, and nobody traces across them.
Disks fill, services stop and connections run out. The first alert is a phone call from a user.
The instance is up, but nobody can see the waits, the locks or the replication lag that explain why it's slow.
Where it goes wrong
How it goes wrongThe server team, the DBAs and the hardware team each watch a different console.
Closed withOne platform covers Windows and Linux servers, Dell and HPE hardware controllers, and four database engines, with a Server Overview and a Database Overview across the fleet.
How it goes wrongA volume creeps toward full and the first alert is the outage.
Closed withDisk usage and free space are evaluated per volume with separate state for each mount, and Oracle tablespaces get their own alert per tablespace. SQL Server shows volume space too.
How it goes wrongThe server is up and pinging, but the service that matters isn't running.
Closed withService state rules, a Service Status table on each server, port connectivity checks, and a file monitor that alerts when a watched file hasn't changed for a set time.
How it goes wrongThe instance answers a ping while connections, caches and locks head for trouble.
Closed withConnection use, cache hit rate, deadlocks, replication lag, tablespace use, page life expectancy and wait classes, each with warning and critical thresholds.
How it goes wrongA fan, a power supply or a disk degrades and nobody looks at the controller.
Closed withDell iDRAC and HPE iLO are polled for health, power and temperature, and iDRAC dashboards add fans, physical disks, RAM slots and the system log.
How it goes wrongThe same cleanup or restart, typed by whoever gets paged.
Closed withAutomated Actions can run approved scripts on Windows and Linux servers when an alert fires, with cooldowns, dry runs and approval for destructive steps.
Servers
CPU, memory, disk by volume, disk I/O, network, processes, and the state of every service, for Windows and Linux.
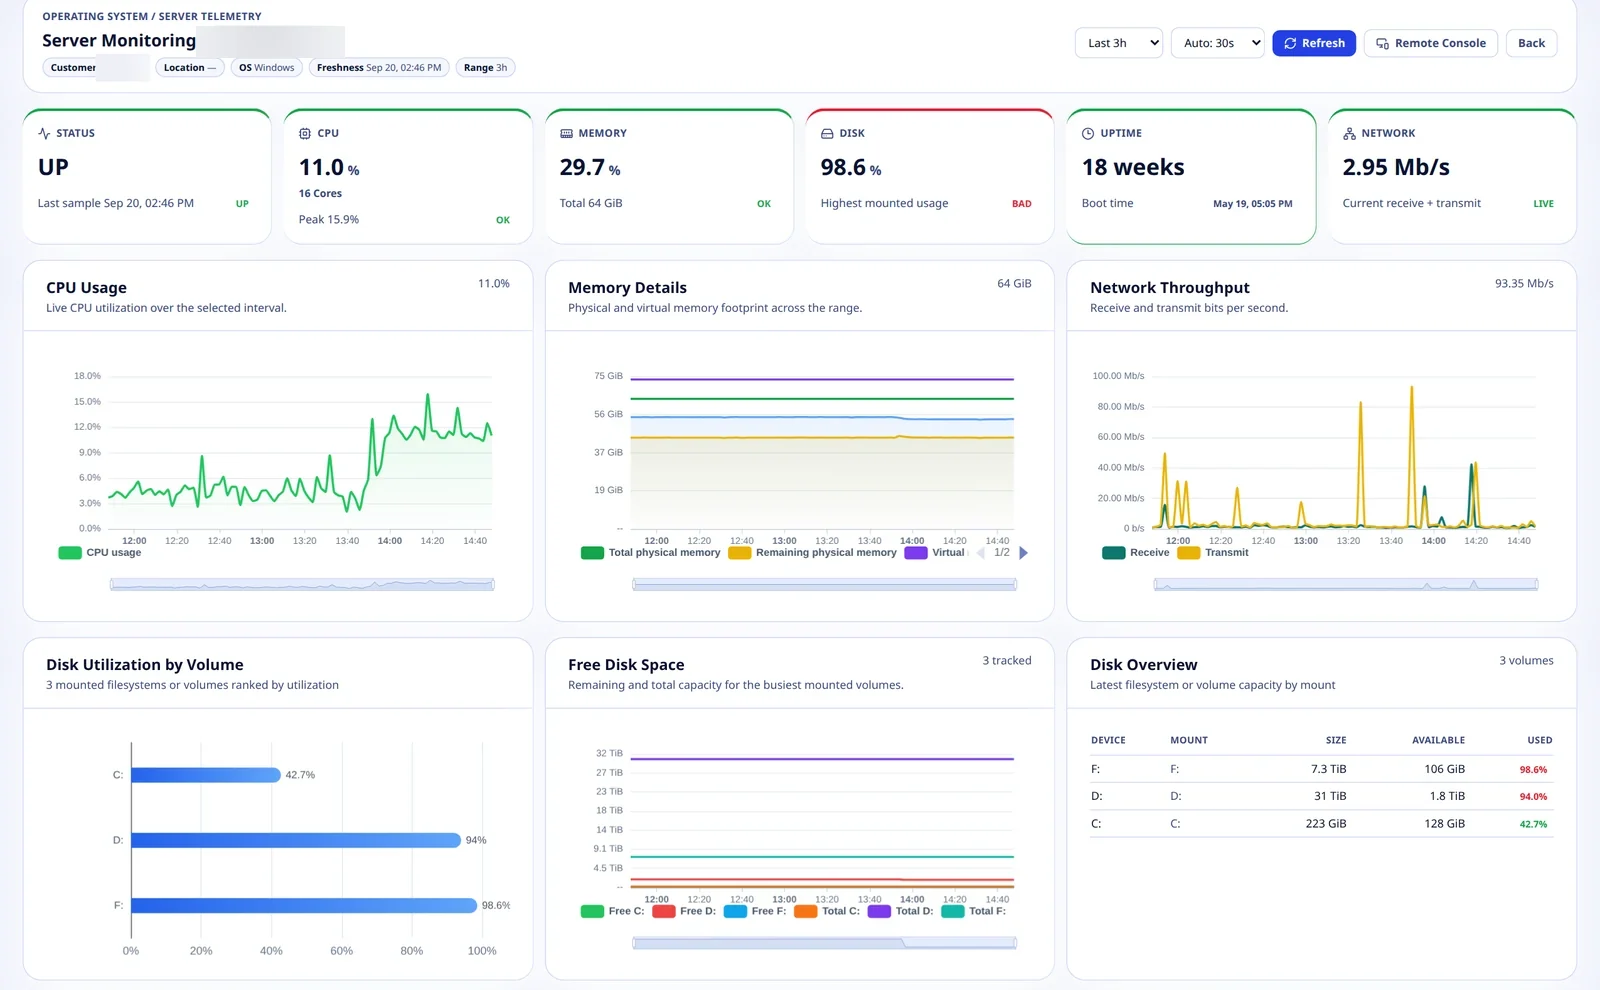
Below the charts, the same page lists processes and threads, disk read, write and I/O, the state of each service with a filter, file monitoring, port connectivity and, on Windows, exception dispatches.
Databases
Pick an engine to see the metrics Unified360 tracks and the sections of its dashboard.
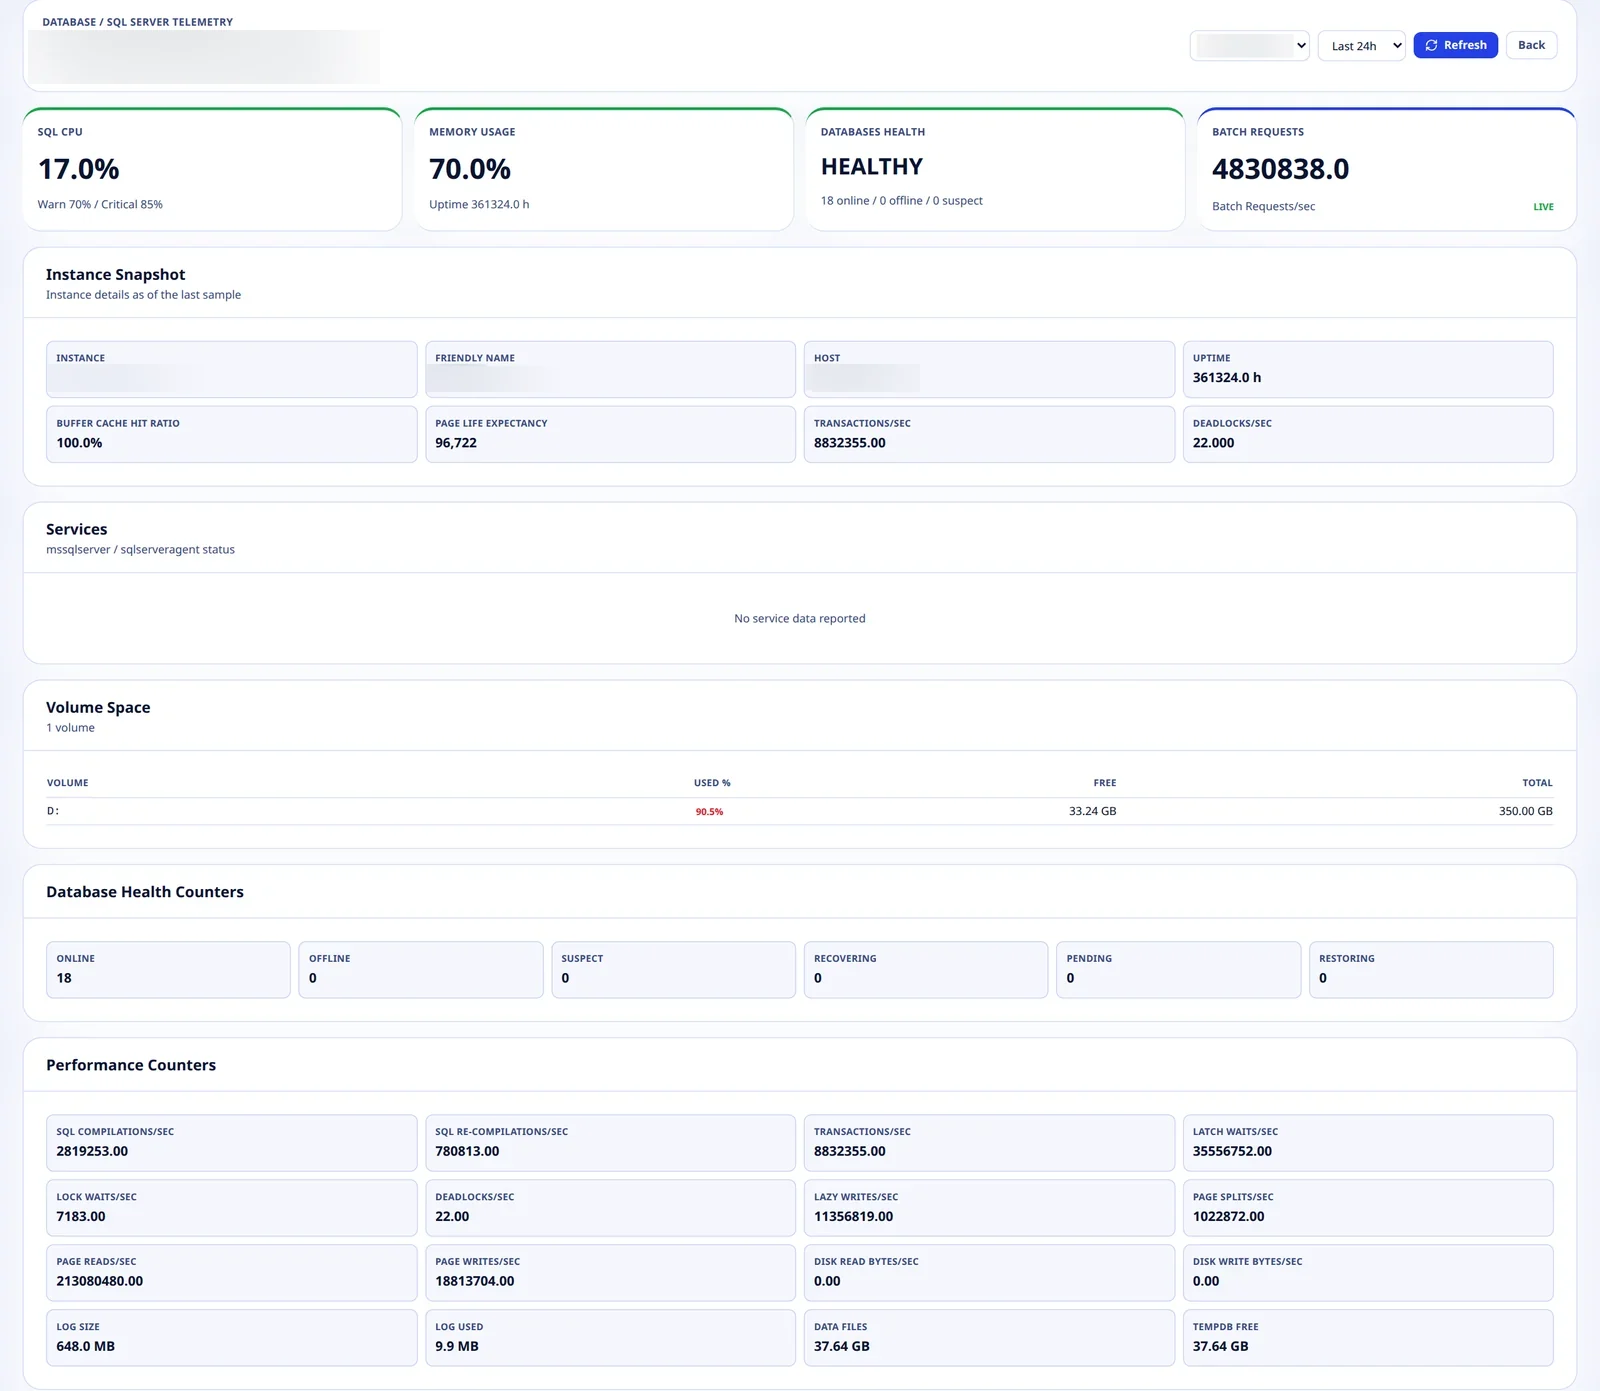
Instance health, memory, batch and transaction rates, and the counters that show pressure.
Availability, sessions, commits, and the wait classes that show where time goes.
Sections of the Oracle detail page.
Connections, cache, deadlocks, replication and transaction activity.
Sections of the PostgreSQL detail page.
Threads, connections, the InnoDB buffer pool and slow queries.
Sections of the MySQL detail page.
Metric names are the ones you can build alert rules on, each with warning and critical thresholds. Only the SQL Server screen is shown here.
What changes
Servers, databases and controllers report into the same platform, so a symptom can be traced down the stack.
Volumes, tablespaces, services and files each have rules, with recovery when they clear.
Connections, cache, locks, deadlocks, waits and replication lag are visible before users complain.
Approved scripts can run when an alert fires, with the guardrails of Automated Actions.
Built with
Operations and observability
Server, database and hardware monitoring, fleet overviews, alerting, and Automated Actions for approved fixes.
Asset and patch management
Hardware and software inventory for your servers, and patch scanning and rollout for Windows and Debian and Ubuntu.
Questions
Windows and Linux servers, through the Grafana Alloy agent, and SQL Server (including Azure SQL Database, Managed Instance and Pool), Oracle, PostgreSQL and MySQL. Tomcat, JBoss and IIS have their own application monitors.
No. It tracks instance counters and rates, such as batch requests, lock waits, deadlocks, wait classes and slow-query rate, and alerts when they cross a threshold. It isn't a query profiler.
Dell iDRAC and HPE iLO controllers are polled over SNMP v2c for health, power and temperature. iDRAC dashboards also show fans, physical disks, RAM slots and system log entries, and the controller reports even when the operating system doesn't.
Rules evaluate disk use and free space per volume, keep separate state for each mount, fire after a set number of consecutive checks and recover when the volume drops back. Oracle tablespaces get their own alert per tablespace.
Yes. Windows service state rules alert when a service isn't running, port connectivity checks confirm a service is reachable, and a file monitor alerts when a watched file hasn't been modified for a set number of seconds.
Yes, through Automated Actions. An alert can start an approved script on a Windows or Linux server, with a cooldown, a dry-run mode and an approval for destructive scripts.
Yes for operating-system metrics: the Alloy agent collects CPU, memory, disk and network and forwards them to Unified360. Databases and hardware controllers are reached from a monitoring agent at the site.
Yes. The Server Overview ranks servers by CPU, memory, disk and network and shows the Windows and Linux split, and the Database Overview shows engine mix, connection use, cache hit rate and replication lag.
See it on your own servers
Tell us which servers and databases you run and we'll show you Unified360 watching them. No commitment required.