
Unknown
Devices, links and virtual machines that never made it into inventory: added in a hurry, changed by a vendor or left over from a project. If nobody knows they exist, nobody monitors them.
IT OPERATIONS
Unified360IT operations & observability platformNetwork TopologyAuto-discovered mapsLink UtilizationBandwidth and link qualityBusiness Service ManagementApplications, services and impactIPAMSubnets, IPs and conflictsAlerting & EscalationDetect, notify, recoverSERVICE & ASSETS
ITDeskIT service management platformIncidents & SLAsOne desk for every requestIntelliAssetIT asset & patch managementPatch ManagementDetect, deploy, roll backISMS Audit PackISO 27001 evidence, readyBY CHALLENGE
Blind Spots in InfrastructureNo extra tools: hardware to URLs on one screenSlow Ticket ResolutionRoute, watch and escalate to fix fasterUnknown Assets & Unpatched SystemsKnow what you own, patch what's exposedUncontrolled Privileged AccessVault, approve, record and auditManual, Repetitive OperationsAutomate approvals and remediationAudit & Compliance PressureEvidence on demandBY STACK
Networks & WirelessSwitches, firewalls and controllersServers & DatabasesWindows, Linux and leading databasesVirtual & Hybrid EstatesHypervisors and hybrid workloadsEndpoints & DevicesAgent-based inventory and updatesRemote & Privileged SessionsAgentless SSH, RDP and VNCTools & IntegrationsITSM, SIEM, webhooks and emailLEARN
Quick Start GuidesSoonGet productive with any Autointelli product in minutes.Product DocumentationAdmin manuals, how-tos and API references.Integration CatalogSoonWhat Autointelli connects to, and how.IT Terms ExplainedPlain-language definitions of everyday IT jargon.DISCOVER
Customer StoriesHow organisations get measurable results.WhitepapersResearch on IT operations, ITSM, ITAM and PAM.Ebooks & PlaybooksPractical, step-by-step operating guides.Product DatasheetsCapabilities and technical specifications.Why AutointelliHow we differ from other platforms.Compare AutointelliSide-by-side with tools you may be weighing.Solution · By Challenge
You don't need another monitoring system. Unified360 covers hardware, operating systems, network, databases, applications and URLs, and puts everything you need on one single screen.
The problem
A blind spot is rarely a failure of effort. It is a gap between what exists, what is watched and what is understood.
Devices, links and virtual machines that never made it into inventory: added in a hurry, changed by a vendor or left over from a project. If nobody knows they exist, nobody monitors them.
Assets that are known but only partly monitored: an interface without thresholds, a database without alerting, a branch link nobody graphs. They look fine until they aren't.
Network, server and application tools that each see their own slice. When something fails, teams argue about whose problem it is because nobody sees how the pieces depend on each other.
No additional monitoring systems
Most blind spots sit between tools. Unified360 monitors hardware, operating systems, network, databases, applications and URLs in one platform, with one alarm console.
Fewer consoles to log in to, fewer gaps between them, and one place to start when something breaks.
Where blind spots hide
The blind spotGear added in a hurry, changed by a vendor or left over from a project never reaches the inventory, so it is never monitored.
Closed withScheduled subnet and SNMP discovery finds it; IPAM tracks addresses, conflicts and stale IPs.
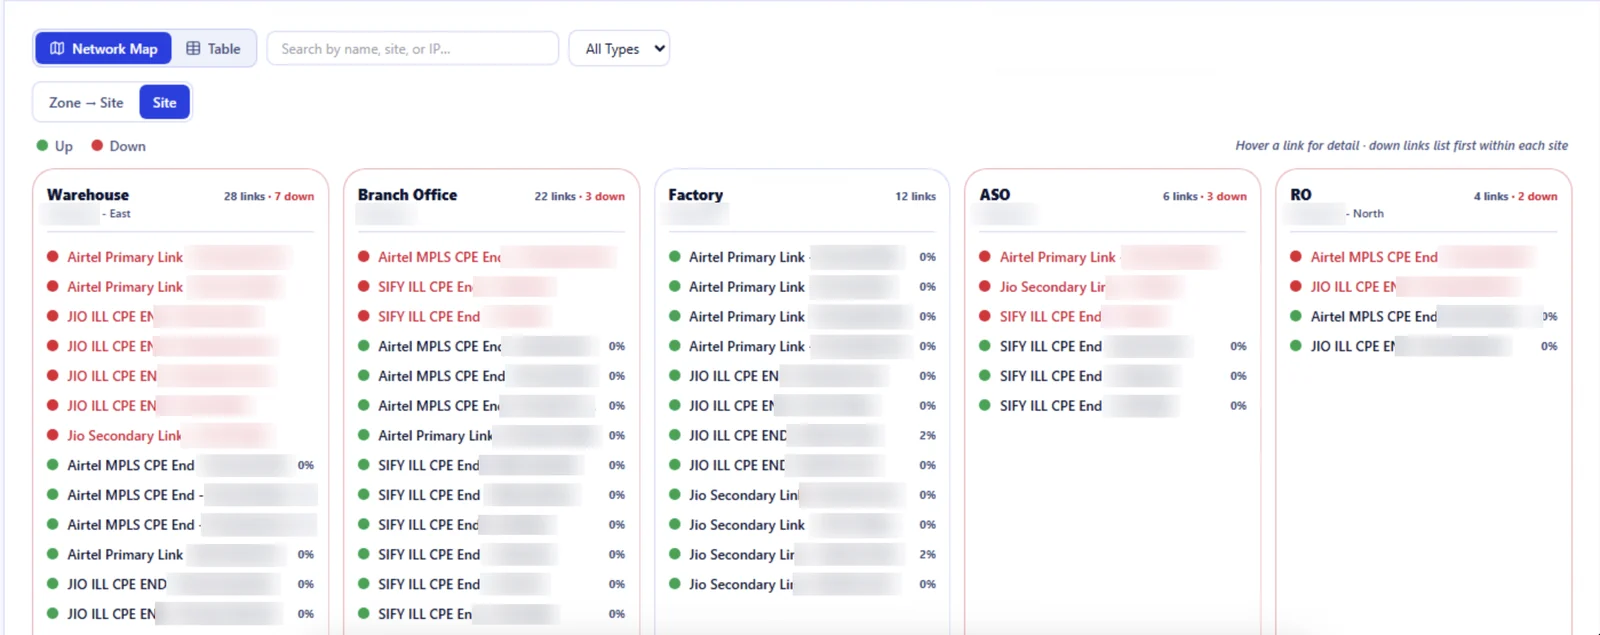
The blind spotISP, ILL and MPLS circuits fail quietly. Users notice before the network team does.
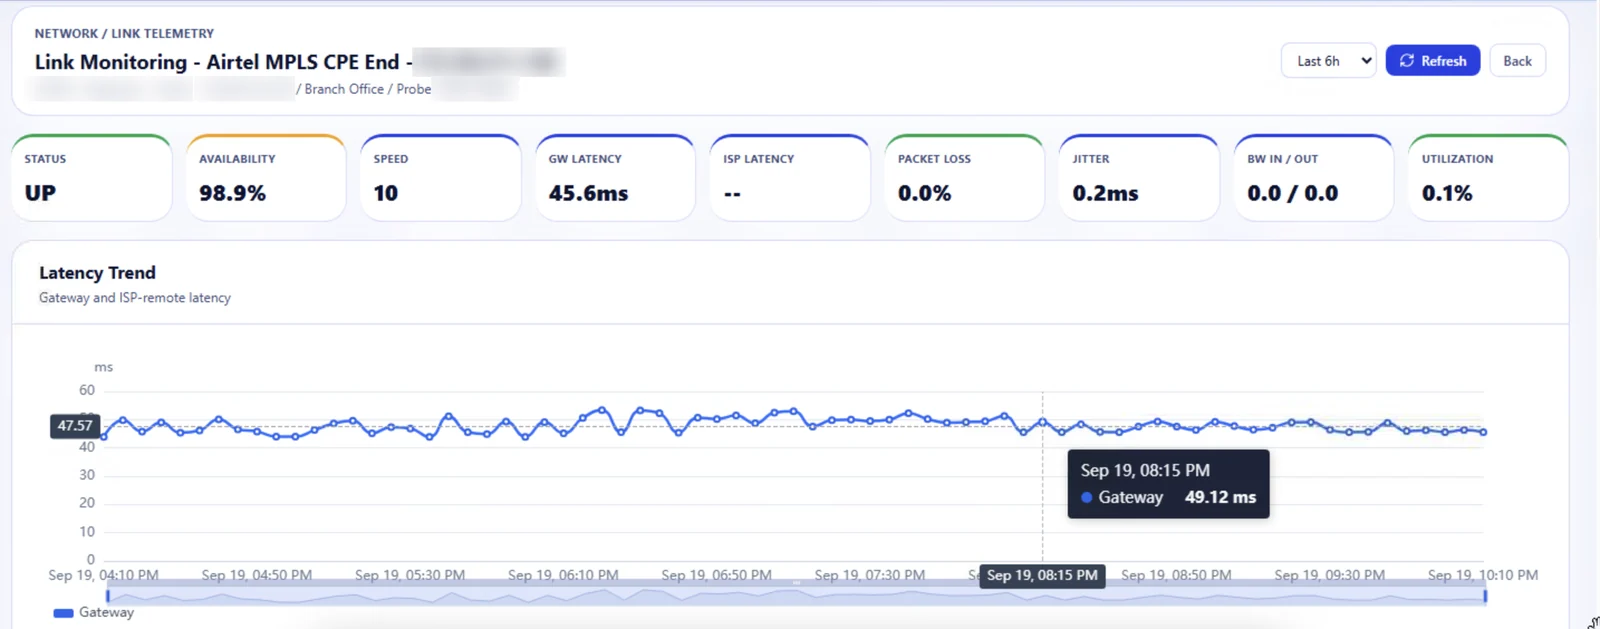
Closed withLink monitoring tracks availability, latency, jitter, packet loss and utilization per link.
The blind spotOne tool for the network, another for servers, a third for applications. Each shows a slice and nobody sees the whole.
Closed withOne console covers network, wireless, servers, databases, hypervisors and applications.
The blind spotThe network drawing was accurate the day it was made. Now nobody trusts it, so nobody can trace impact.
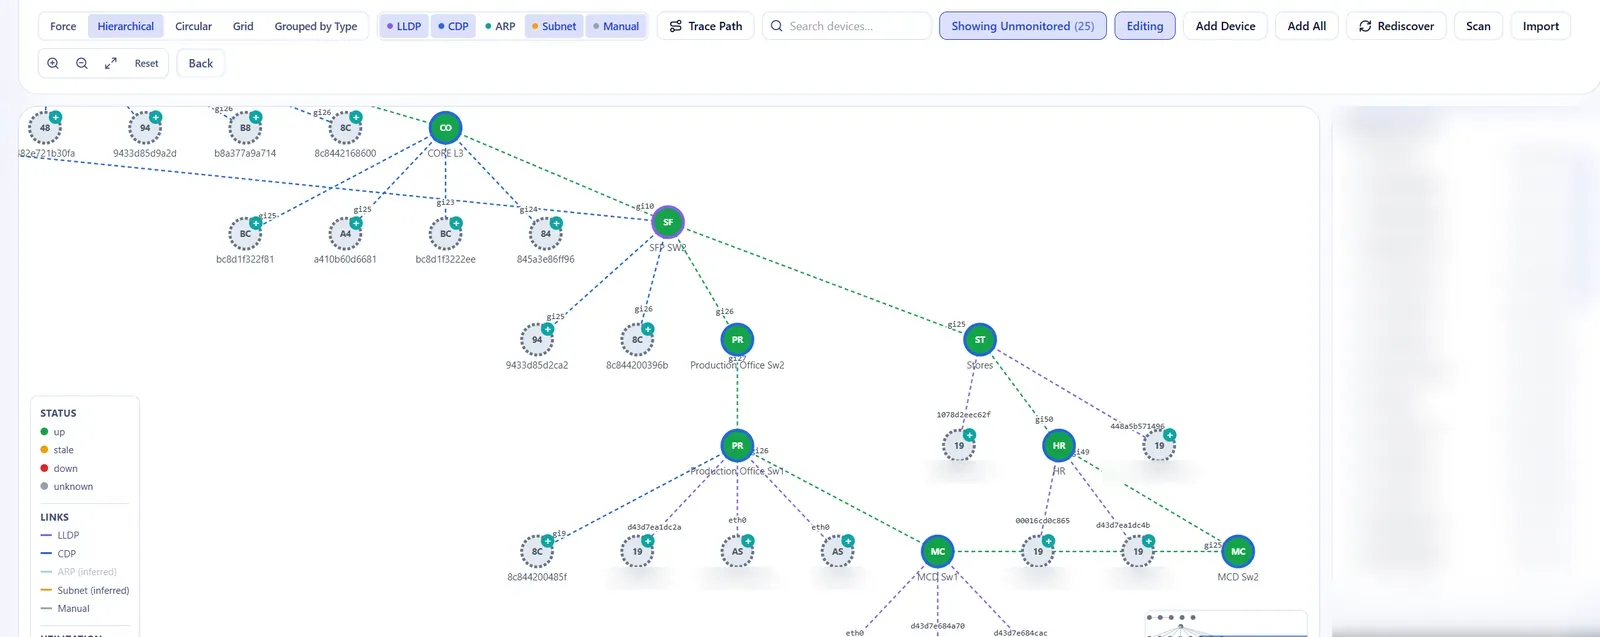
Closed withTopology is built from LLDP, CDP, ARP and subnet data, with manual links and a rediscover action.
The blind spotEither too little, so problems slip through, or a flood nobody can prioritise.
Closed withRule-based alerts with matching recovery notices, escalation policies and one Alarm Console with history.
The blind spotServers, virtual machines and out-of-band controllers that sit outside the normal monitoring net.
Closed withAgents for Windows and Linux; vCenter, Proxmox and Nutanix; Dell iDRAC and HP iLO hardware health.
How Autointelli closes them
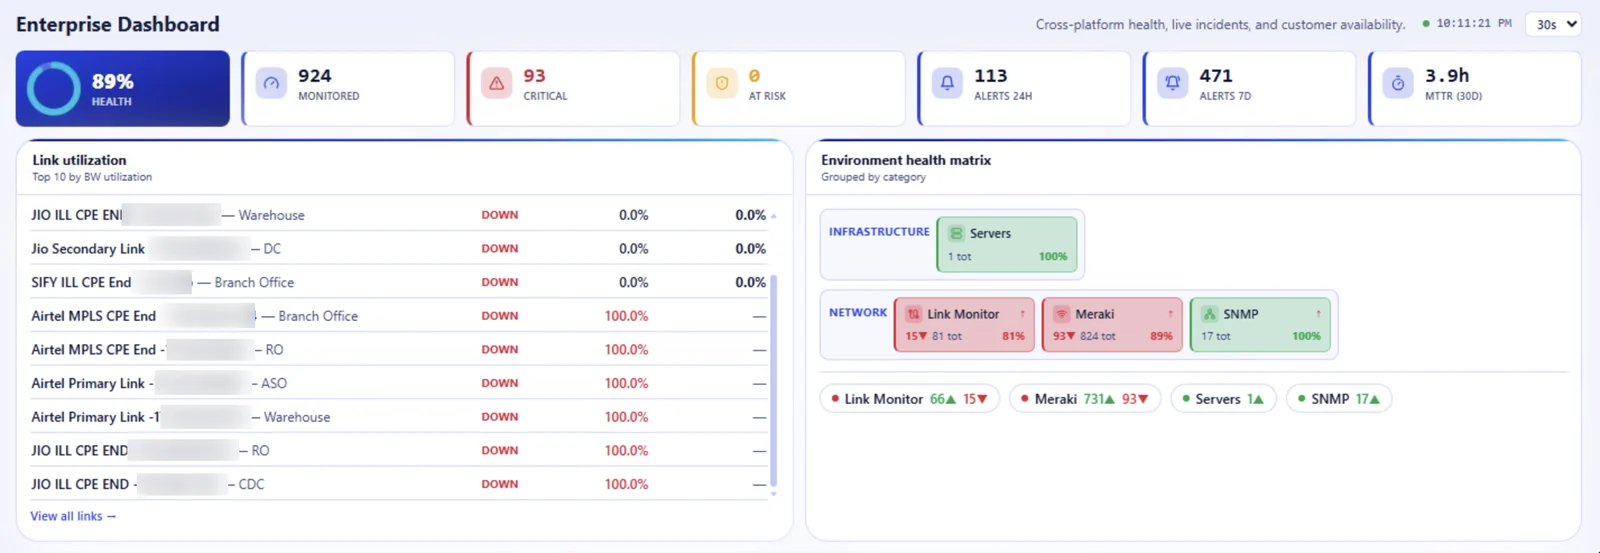
Four steps, one platform. Each screen below is real product, with identifying details blurred.
Step 1 · Discover
Step 2 · Monitor
Step 3 · Connect
Step 4 · Act
Coverage
Six layers, one console, one alerting engine. No extra monitoring system for any of them.
Any SNMP-capable device is covered through the generic template, and new vendor templates reach your agents within about a minute, with no restart needed.
Business Service Management
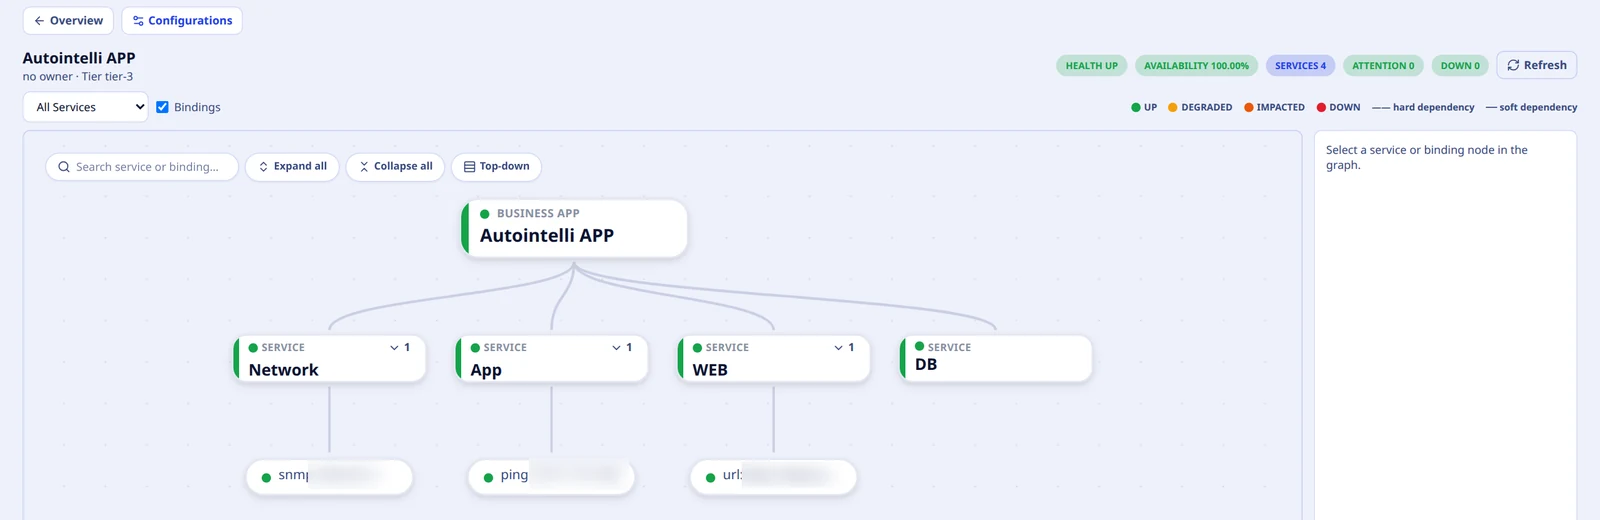
Monitoring each device is only half the job. Business Service Management ties the monitors to the services and applications the business depends on, so a failing disk, database or link shows up as impact on the application.
Group services into a business application with a tier and an owner, and give each service a criticality.
Bind services to servers, databases, URLs, ports and links, and record which services depend on which.
UP, DEGRADED, IMPACTED and DOWN from monitor to service to application, with critical-path and down-only views.
Before & after
Drag the handle. Left is what a patchwork of tools shows. Right is one connected picture.
Illustrative network with sample data. In this example, 5 of 12 devices are unseen without a single view, and all 12 are monitored and connected with one.
See it live
Screens are from the product running on real data; identifying details have been blurred.
What changes
Thresholds, link monitoring and escalation put the first alert in front of the right person, not the first support call.
Topology, relationships and one alarm history show what is affected and where to look first.
Discovery, IPAM and the object registry keep the record of what exists close to what is really there.
Utilization and performance trends on links, servers and disks turn upgrades into decisions, not surprises.
Built with
IT operations & observability
Monitoring for network, servers, databases, hypervisors, wireless and applications, plus topology, link monitoring, IPAM, alerting and automation.
Explore Unified360IT asset management
An independent view of what exists: agent-based inventory, discovery through AD, LDAP, SNMP, WMI and SSH, lifecycle tracking and a CMDB.
Explore IntelliAssetQuestions
No. Unified360 covers hardware (Dell iDRAC, HP iLO and hypervisors), Windows and Linux operating systems, network devices and wireless, SQL Server, Oracle, PostgreSQL and MySQL, IIS, Tomcat and JBoss, and URL, port and ping checks. They share one console, one alarm console and one alerting engine.
It lets you model a business application as services bound to the monitors underneath, with dependencies between services. Health then travels up from monitor to service to application, so a failing database or link shows up as impact on the application it supports.
No. Network devices are monitored agentless over SNMP, and databases, hypervisors and wireless controllers are reached through their own interfaces or APIs. A lightweight agent is used for Windows and Linux servers and desktops, where it reports CPU, memory, disk, network, services and file changes.
Discovery jobs sweep subnets and IP ranges and use SNMP with device fingerprinting, and IPAM keeps track of addresses, conflicts and stale IPs. If you also run IntelliAsset, its agents and discovery through Active Directory, LDAP, WMI, PowerShell and SSH add a second, independent view of what exists.
The map is built from LLDP, CDP, ARP and subnet data, and links can also be added by hand. You can filter by discovery source and run a rediscover to refresh it, so it follows the network instead of a drawing someone made once.
Alerts are rule-based with thresholds and evaluation windows, each alert has a matching recovery notice, escalation policies route unresolved alarms level by level, and everything lands in one Alarm Console with event history, so you can tune what you see instead of ignoring it.
Yes. Unified360 is self-hosted and runs on your own servers, including air-gapped sites through an offline installer. Proxy servers collect data at remote sites and report back to one console.
Yes. Data, roles and permissions are customer-scoped, and proxy servers let distributed sites report into a single console.
See it on your own network
Tell us about your environment and we'll show you Unified360 running against it. No commitment required.